

Caffeine Nation: What 416 Australians taught us about habits, rituals, and what’s brewing next
Most Australians aren’t just drinking caffeine. They’re living on it.
In one of our latest projects, we asked 416 people about their caffeine habits — what they drink, when, and why. What we found is equal parts predictable and revealing. Yes, coffee is still king. But look a little closer and you’ll see energy drinks edging in, new rituals forming, and plenty of space for something different.
This research lives inside Ideally. And now, for the first time, you can explore it for yourself.
→ See the full Caffeine project in Ideally
(If you’re not on your team’s account, you will still be able to view the full project)

Coffee, still king but people are still restless
Coffee is the daily anchor for most Australians: 84% had a cup in the past three months, and 44% drink caffeine multiple times a day. But dig in and the picture gets more interesting. High-frequency drinkers are especially concentrated in older age groups (57% of 65–74s) and high-income households (56% earning over $150k). Meanwhile, a new crowd is quietly reshaping the morning ritual… energy drinks have crept into the mix, with 31% reaching for them, especially younger people and men.
The energy drink surge
Energy drinks aren’t just for late-night crammers anymore. In our data, nearly one in three people (31%) said they’d had an energy drink recently. This is a younger, more male-skewed audience, with 38% of men and a hefty share of 18–34-year-olds opting in. In the platform, you can filter for this cohort and ask sharper questions: are they just swapping out coffee, or layering caffeine on top?
Change is (mostly) slow, but real
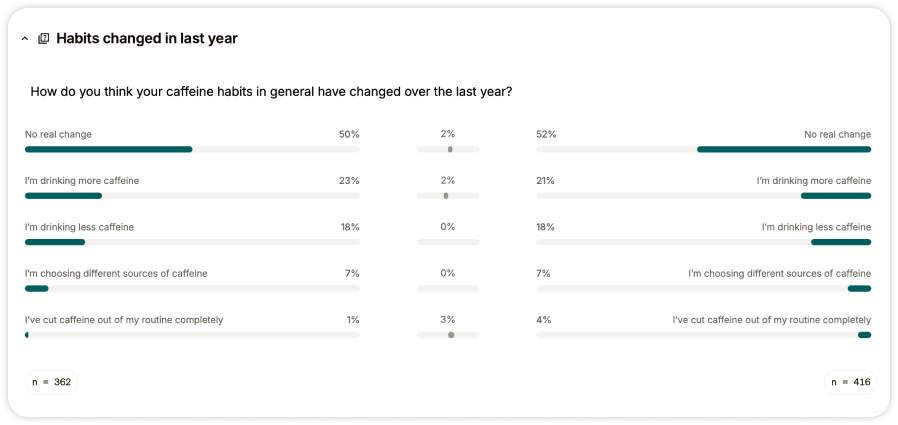
The story isn’t one of a nation upending its habits overnight. Just over half (52%) said their caffeine use hasn’t changed at all in the past year. But there’s movement under the surface: 21% are drinking more caffeine, mostly younger adults (18–24: a hefty 31%). Only 4% have quit. And motivations vary: some are reaching for new types (7% trying new sources), while others are paring back for health or sleep.
Finding the matcha moment
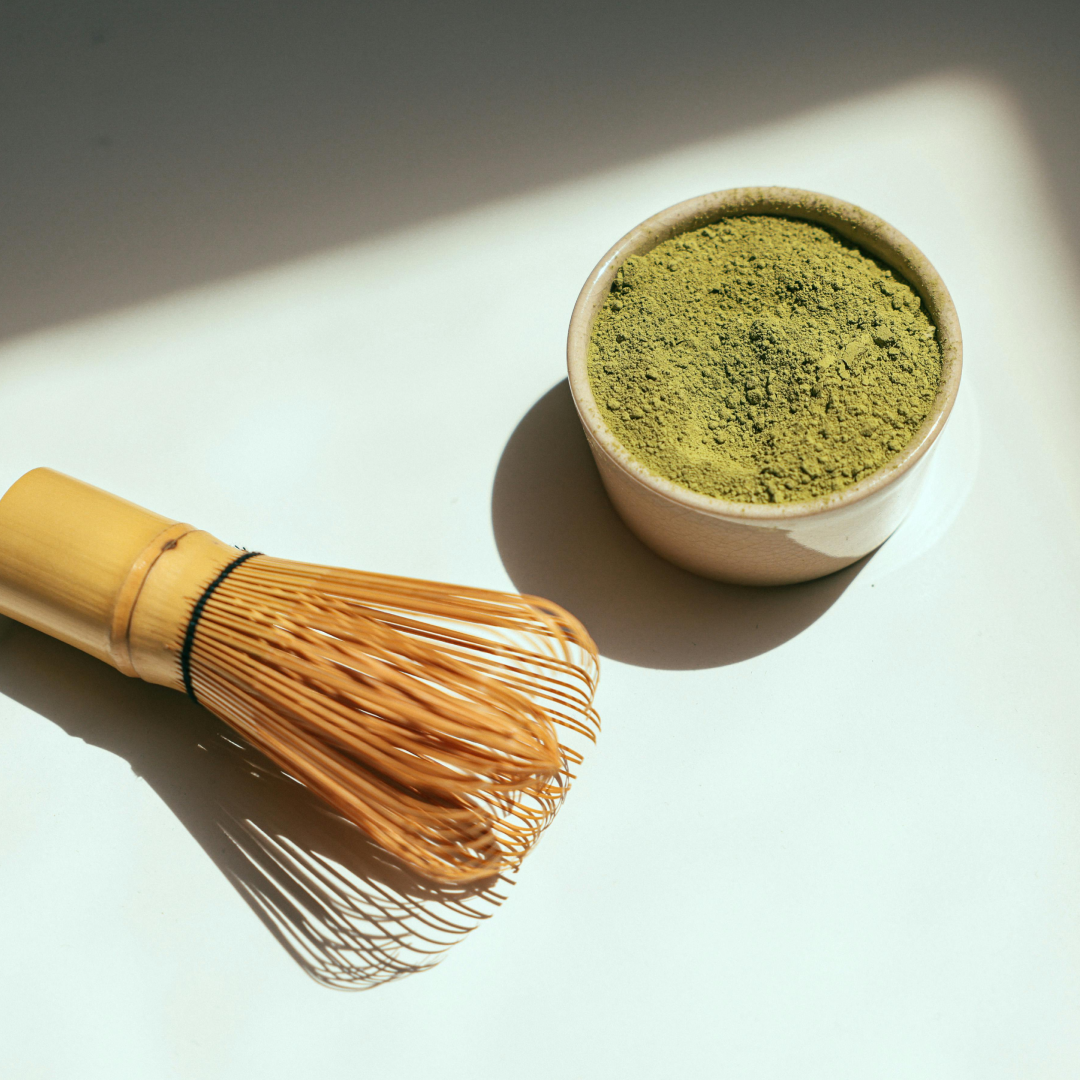
Not all caffeine trends are loud. Some, like matcha, build slowly but steadily. In this study, about 23% of people said they’d try matcha chocolate or confectionery, and the same proportion showed interest in matcha protein bars. Among younger groups (18–24), nearly a third were keen on matcha protein bars, while matcha baked goods also stood out. But there’s a flip side: nearly half (47%) of all respondents weren’t interested in any matcha innovations at all. With a couple of clicks, you can compare interest in matcha by age, income, region, or family type to figure out if it’s a passing fad or a slow burn waiting to catch.
How people feel about caffeine
Data is nothing without sentiment. In this study, 44% called caffeine a “daily essential,” a figure that climbs with age (up to 58% for 65–74s) and income. At the same time, a younger, lower-income crowd is more likely to see it as a guilty pleasure or, sometimes, not touch it at all. In the platform, you can map sentiment by every demographic variable, or pull out verbatim to see what “essential” really means to different people.
That’s the kind of signal Ideally helps you spot. Clear patterns. Quiet shifts. Micro-trends before they go mainstream.
Filter it
Topline stats are helpful. But the real value often hides just beneath. Use filters to dig deeper: by age, gender, region, household type, income bracket. Want to know what 24-year-olds in VIC think about mushroom coffee? Go for it. See how trends split across groups, then ask why. Ideally makes it easy to turn surface-level patterns into sharper, more targeted insights.

Get inspired and spin it
Every good question opens the door to a dozen more. Maybe you’re curious about caffeine and wellness. Maybe you’re thinking about rituals — the ones people stick to every day, without even noticing. With Ideally, you can take a live project like this one and build your own branch. Duplicate it. Tweak the screener. Add a new angle. Suddenly you’re not starting from scratch, you’re evolving a question that already sparked something.
Compare it
Ever want to know not just what people think, but who thinks it? Ideally’s head-to-head comparison feature lets you pit different audience groups against each other, side by side. Want to see how Gen Z stacks up against Boomers on energy drinks? Or how coffee loyalists respond to a new matcha concept, versus the “never touch the stuff” crowd? Just pick your audiences: all respondents, filtered segments, or profiles you select yourself. You’ll see the differences, not just in topline stats, but across every metric and open-end. And if you’re testing more than one idea, you can run concept-vs-concept showdowns to see which really lands with your market.
Hear it
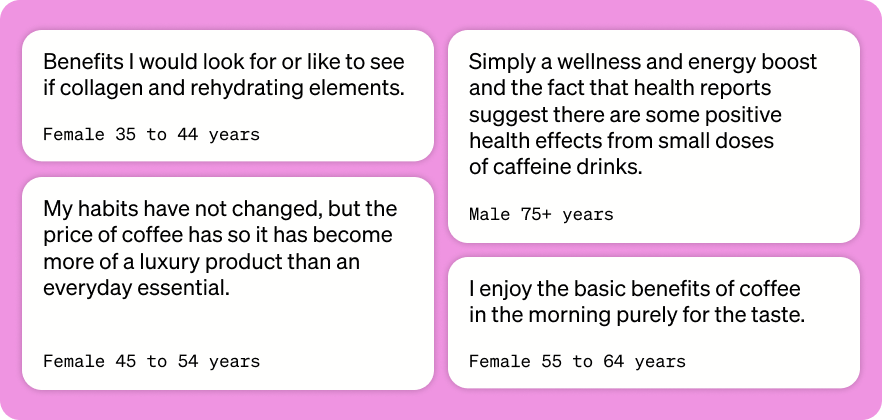
The charts tell you what’s happening. But the open-ends tell you why. In this caffeine study, we saw that most people hadn’t changed their habits, but when they had, it was because of health, sleep, cost, or stress. That context came from the verbatim. The comments. The little sentences that make the data human. Ideally blends qual and quant in a single flow, so you can scale your sample size without losing the nuance. You don’t have to choose between statistically significant and emotionally resonant because you get both.
Share it
Every shared project from Ideally can now be found in your ‘Get inspired’ tab — a feed of research worth exploring. These aren’t just case studies. They’re working examples you can use to get inspired, borrow, remix, or build on. If you’re already an Ideally user, just click through and dive in. If you’re not set up yet, you’ll be able to request access with one click. Either way, you’re in.

Focus it
Sometimes you don’t need a full study, you need a slide. A single chart that sharpens your pitch. A graph that makes the problem obvious. Ideally helps you take what matters and bring it into the room. You can export visuals or full presentations, build briefs from real data, and shape strategies grounded in what people actually think and do. No fluff. No guesses.
Steal from us
You don’t have to invent the wheel every time. If you like how this project is structured… the survey flow, the framing, the language, use it as a template. Swap caffeine for skincare, or travel, or AI. The bones stay the same, the topic shifts. Ideally isn’t just a tool for answers. It’s a tool for asking better questions, faster.
Why we’re sharing projects like this:
The best research doesn’t sit in slides. It moves — between teams, topics, and conversations. That’s why we’ve made it easy for Ideally staff to share projects we’ve conducted with customers and prospects to explore the big questions and themes you have in your industries. It’s also why we’re building a better way to browse, learn from, and remix great work already happening inside your company.
Because the best ideas often start with someone else’s question.


